
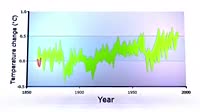
CO2 concentration changes, 1960-2015. Animated graph showing the trend of steadily increasing carbon dioxide (CO2) concentration in the Earth's atmosphere between the years 1960 and 2015. This is known as the Mauna Loa CO2 record. It is recorded at the Mauna Loa Observatory, Hawaii. Relatively isolated due to its mid-Pacific location, this is the longest record made of direct measurements of atmospheric CO2. It shows a steady increase in concentrations (measured in parts per million, ppm) from less than 320 ppm to over 400 ppm. Started by C. David Keeling of the Scripps Institution of Oceanography in March 1958, the graph is known as the Keeling Curve. This increase in the greenhouse gas CO2, due to human activities such as fossil fuel consumption, is a key cause of global warming. This is a zeroed y-axis graph, with the increase difficult to see. For a truncated graph showing the increase, see clip K005/6413. For a historical record over hundreds of thousands of years, see clip K005/6414.


Details
WebID:
C01859847
Clip Type:
RM
Super High Res Size:
1920X1080
Duration:
00:00:13.000
Format:
QuickTime
Bit Rate:
24 fps
Available:
download
Comp:
200X112 (0.00 M)
Model Release:
NO
Property Release
No
 Loading