
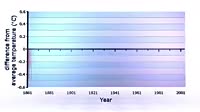
Global temperature changes, 1850-2000. Animated graph showing the trend in global surface temperature changes between the years 1850 and 2000. The graph shows both the observed temperature change (red line) and the changes as predicted by a climate change simulation (green line). This simulation models changes due to variations in solar activity, the effect of volcanic eruptions, and human activity such as fossil fuel consumption and deforestation. The model agrees with the observations, demonstrating how the rise in temperature from 1960 onwards (a rise of around 1 degree Celsius) is due to human activities (anthropogenic global warming). Previous models, which didn't take human activities into account, failed to show the observed rise in temperatures (see clip K005/6412).


Details
WebID:
C01859851
Clip Type:
RM
Super High Res Size:
1920X1080
Duration:
00:00:11.000
Format:
QuickTime
Bit Rate:
24 fps
Available:
download
Comp:
200X112 (0.00 M)
Model Release:
NO
Property Release
No
 Loading