
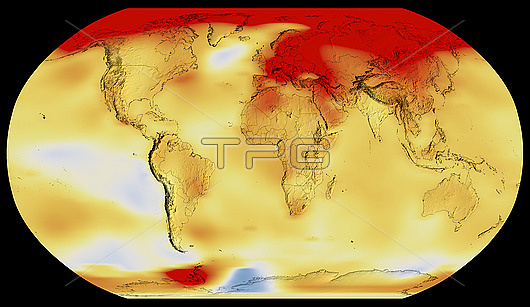
Global temperature anomalies, 2018-2022. This image shows the average land and sea surface temperatures from 2018-2022, compared to the 1951-1980 average. Areas that are hotter than normal are red, those that are cooler are blue. 2022 tied with 2015 as the fifth warmest year since modern record-keeping began in 1880. Scientists attribute this warming to increased carbon dioxide and other greenhouse gases in the atmosphere due to human activity.
| px | px | dpi | = | cm | x | cm | = | MB |
Details
Creative#:
TOP28868329
Source:
達志影像
Authorization Type:
RM
Release Information:
須由TPG 完整授權
Model Release:
n/a
Property Release:
n/a
Right to Privacy:
No
Same folder images:
2000s2010s2018202221stcenturyabnormalafricaanomalyantarcticantarcticaarcticartworkasiaasianaustralasiablackbackgroundcentralamericaclimateclimatechangeclimatologicalclimatologyearthobservationenvironmentenvironmentaleurasiaeuropeeuropeanfiveyeargeographicalgeographyglobalglobalwarminggraphicillustrationlandsurfacelatinamericameteorologicalmeteorologymodelno-onenobodynorthamericanorthamericanoceaniarobinsonprojectionseasurfacesouthamericatemperatureanomaliesworldwide
2000s2010s2018202221stabnormalafricaamericaamericaamericaamericaamericananomaliesanomalyantarcticantarcticaarcticartworkasiaasianaustralasiabackgroundblackcentralcenturychangeclimateclimateclimatologicalclimatologyearthenvironmentenvironmentaleurasiaeuropeeuropeanfivegeographicalgeographyglobalglobalgraphicillustrationlandlatinmeteorologicalmeteorologymodelno-onenobodynorthnorthobservationoceaniaprojectionrobinsonseasouthsurfacesurfacetemperaturewarmingworldwideyear
 Loading