
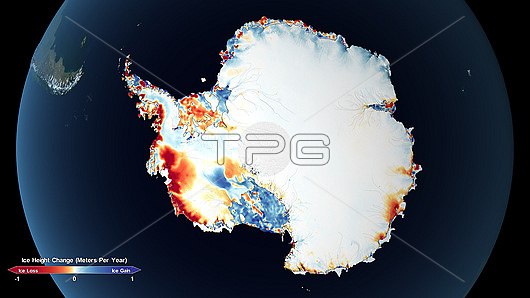
Visualisation showing changes in ice thickness in Antarctica using data from IceSat (2003-2009) and IceSat-2 (2018-) satellites. Red-orange areas show a reduction in ice height whilst blue areas show an increase in ice height.
| px | px | dpi | = | cm | x | cm | = | MB |
Details
Creative#:
TOP26811852
Source:
達志影像
Authorization Type:
RM
Release Information:
須由TPG 完整授權
Model Release:
N/A
Property Release:
N/A
Right to Privacy:
No
Same folder images:
 Loading