
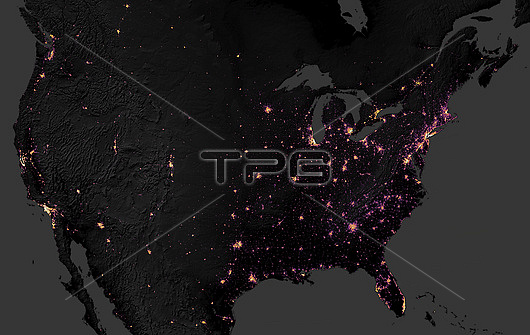
Carbon footprints of North American cities. Map based on satellite data of carbon dioxide (CO2) emissions from cities in North America. This image combines data from the Global Human Settlement Layer (GHSL) with observations with the Operational Land Imager (OLI) on the Landsat 8 satellite. The CO2 levels are colour-coded from black and purple (low) through pink, red, orange and yellow to white (high). Major US cities shown here include Los Angeles, Chicago and New York. This map uses data from 2013.
| px | px | dpi | = | cm | x | cm | = | MB |
Details
Creative#:
TOP26514868
Source:
達志影像
Authorization Type:
RM
Release Information:
須由TPG 完整授權
Model Release:
N/A
Property Release:
N/A
Right to Privacy:
No
Same folder images:
americanartificialcarbondioxidechicagocitiescitycivilisationclimatechangeclimatologicalco2continentaldarkdensitydevelopedgeographicalglobalwarminggreenhousegasinhabitedlosangelesnewyorknight-timeno-onenobodynorthamericanpopulatedpopulationtechnologicalunitedstatesurbanususaoperationallandimagernorthamericacontinentmapcarbonfootprintearthobservationclimatologyhumangeographysatelliteimagefromspacesatellitelandsat8olinight21stcentury2013
201321st8americaamericanamericanangelesartificialcarboncarboncenturychangechicagocitiescitycivilisationclimateclimatologicalclimatologyco2continentcontinentaldarkdensitydevelopeddioxideearthfootprintfromgasgeographicalgeographyglobalgreenhousehumanimageimagerinhabitedlandlandsatlosmapnewnightnight-timeno-onenobodynorthnorthobservationolioperationalpopulatedpopulationsatellitesatellitespacestatestechnologicalunitedurbanususawarmingyork
 Loading