
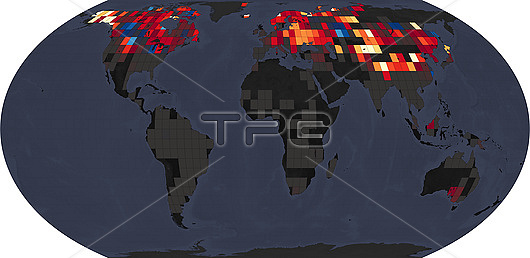
Map showing the changes in river ice conditions between 1984 and 2018. Looking across the three decades, researchers found an average global monthly decline in river ice extent of 2.5 percentage points. Grey and black areas indicate no change and red, orange and yellow indicate decreases in river ice coverage. In March, when the largest changes occurred, there was a 4.3 percentage point decline. The greatest declines occurred in the Tibetan Plateau, eastern Europe, and Alaska. Data from more than 400,000 Landsat images were analysed using Google Earth Engine to track when each river had ice.
| px | px | dpi | = | cm | x | cm | = | MB |
Details
Creative#:
TOP26298623
Source:
達志影像
Authorization Type:
RM
Release Information:
須由TPG 完整授權
Model Release:
N/A
Property Release:
N/A
Right to Privacy:
No
Same folder images:
 Loading