
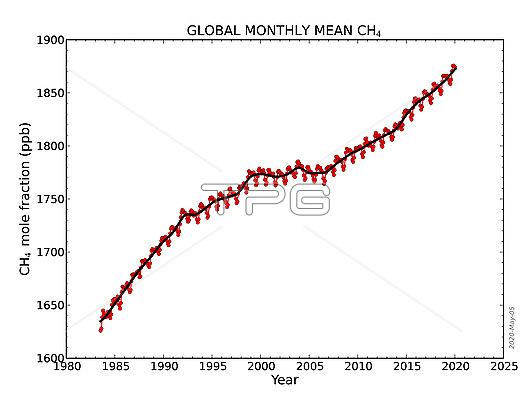
Graph showing global-averaged monthly mean atmospheric methane (CH4) levels as determined from marine surface sites since 1983. The levels are given as a dry air mole fraction, which is the number of methane molecules divided by the total number of molecules in a sample after water vapour has been removed. Methane is a powerful greenhouse gas. It is produced by modern agricultural practices and the decomposition of organic matter. The red lines and circles are globally averaged monthly mean values centered on the middle of each month. The black line and squares show the long-term trend (similar to a 12-month running mean) where the average seasonal cycle has been removed.
| px | px | dpi | = | cm | x | cm | = | MB |
Details
Creative#:
TOP25746964
Source:
達志影像
Authorization Type:
RM
Release Information:
須由TPG 完整授權
Model Release:
N/A
Property Release:
N/A
Right to Privacy:
No
Same folder images:
 Loading