
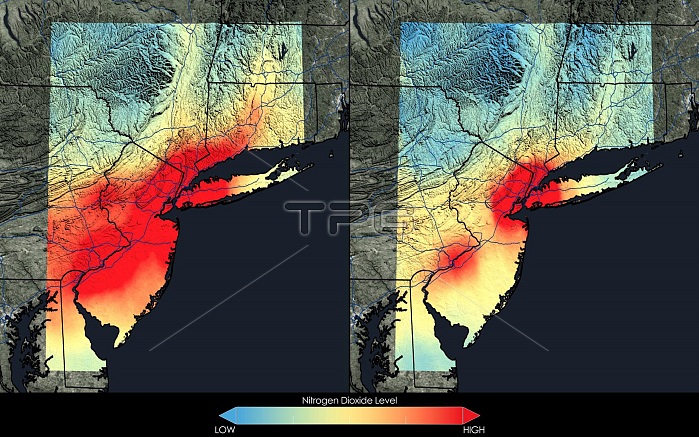
This image shows how nitrogen dioxide concentrations during spring and summer months, averaged from 2005-2007 (left), compare to the average from 2009-2011 (right), reflecting a 32 percent decrease in nitrogen dioxide between the two periods. Measurements of nitrogen dioxide from the Ozone Monitoring Instrument on NASA's Aura satellite depict the concentration of the gas throughout a column of air in the troposphere, Earth's lowest atmospheric layer. The images are color-coded: orange and red areas denote high concentrations and blue and green denote lower concentrations.
| px | px | dpi | = | cm | x | cm | = | MB |
Details
Creative#:
TOP22314970
Source:
達志影像
Authorization Type:
RM
Release Information:
須由TPG 完整授權
Model Release:
N/A
Property Release:
No
Right to Privacy:
No
Same folder images:
atmospheretroposphereenvironmentalenvironmentozonelayerozonemonitoringinstrumentaurasatellitemonitoringozonesmoggastoxicitytoxicairpollutantairpollutionairqualitypollutiondecreasereducedreductionpatternconcentrationlevelnitrogendioxidediagramchartillustrationgraphicmeasurementnorthamericaunitedstatesussummermapdatascienceearthobservation
airairairamericaatmosphereaurachartconcentrationdatadecreasediagramdioxideearthenvironmentenvironmentalgasgraphicillustrationinstrumentlayerlevelmapmeasurementmonitoringmonitoringnitrogennorthobservationozoneozoneozonepatternpollutantpollutionpollutionqualityreducedreductionsatellitesciencesmogstatessummertoxictoxicitytroposphereunitedus
 Loading