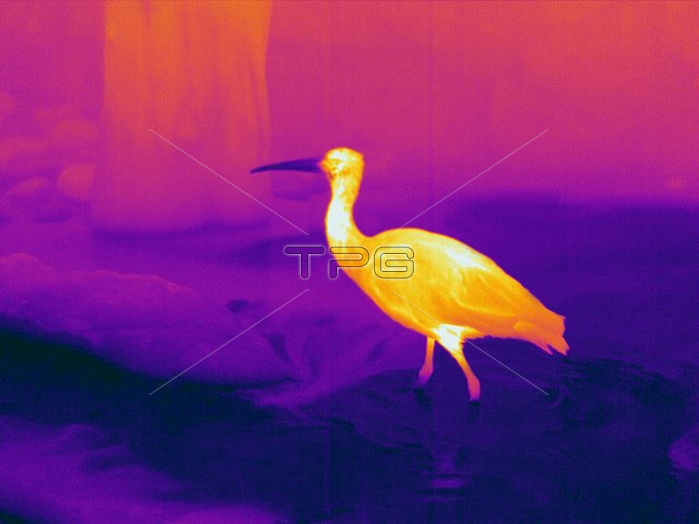
Thermogram of a Scarlet Ibis (Eudocimus ruber). The different colors represent different temperatures. The lightest colors are the hottest temperatures, while the darker colors represent cooler temperatures. Thermography uses special cameras that can detect light in the far-infrared range of the electromagnetic spectrum (900簫14,000 nanometers or 0.9簫14 繕m) to create an image that represents an objects temperature.
| px | px | dpi | = | cm | x | cm | = | MB |
Details
Creative#:
TOP22287616
Source:
達志影像
Authorization Type:
RM
Release Information:
須由TPG 完整授權
Model Release:
N/A
Property Release:
No
Right to Privacy:
No
Same folder images:
eudocimusibiseudocimusruberscarletibisciconiiformeswatermarshbirdwetlandbirdwadingbirdwaterbirdwaterbirdbirdaveswildlifevertebratevertebratachordatechordataanimaliaanimalfaunaradiateradiationthermalradiationelectromagneticspectrumspectrumheatradiationinfraredradiationinfraredtemperaturecoldheathotthermalthermographythermographthermographicthermogram
animalanimaliaavesbirdbirdbirdbirdbirdchordatachordateciconiiformescoldelectromagneticeudocimuseudocimusfaunaheatheathotibisibisinfraredinfraredmarshradiateradiationradiationradiationradiationruberscarletspectrumspectrumtemperaturethermalthermalthermogramthermographthermographicthermographyvertebratavertebratewadingwaterwaterwaterbirdwetlandwildlife

 Loading