
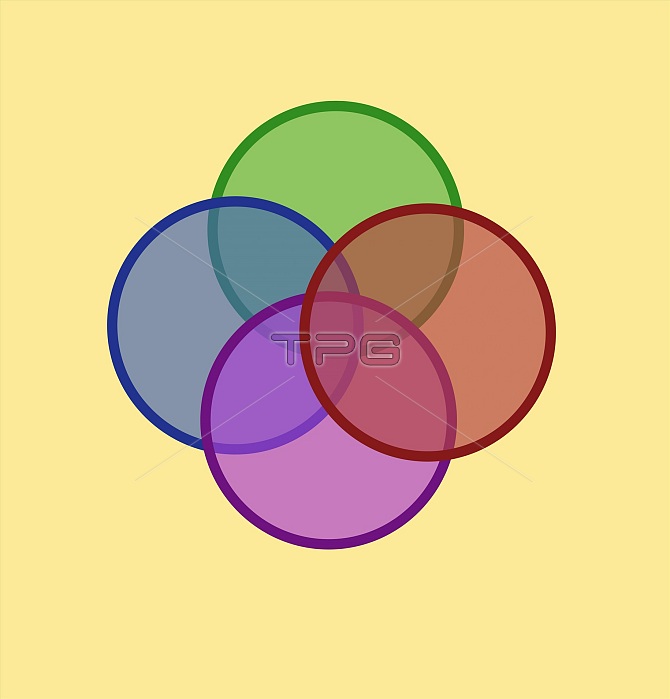
Venn diagrams display the overlap of circles colored in red, purple, green and blue. The venn diagram is named after the British logician John Venn (1834-1923). These diagrams are used in mathematical and scientific disciplines, such as set theory, probability theory, statistics and computer science.
| px | px | dpi | = | cm | x | cm | = | MB |
Details
Creative#:
TOP22141092
Source:
達志影像
Authorization Type:
RM
Release Information:
須由TPG 完整授權
Model Release:
N/A
Property Release:
No
Right to Privacy:
No
Same folder images:
 Loading