
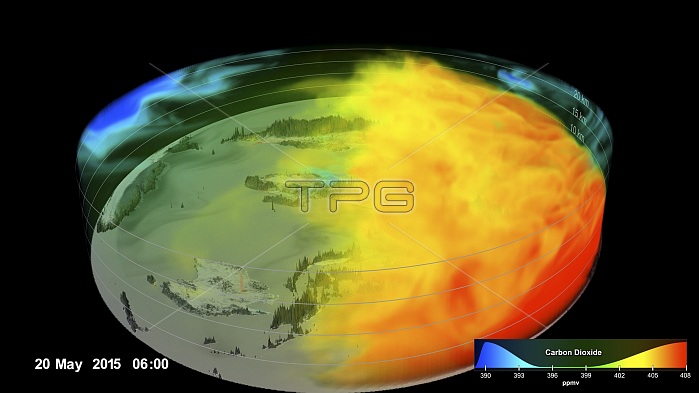
Northern hemisphere carbon dioxide. 3D visualization showing the complex patterns by which carbon dioxide in the atmosphere increases, decreases and moves around the globe with the seasons and the weather. Blue areas are below average (CO2 absorption), while red-yellow areas are above average (CO2 accumulation). The visualisation covered the period from September 2014 to September 2015. This still image shows the levels of carbon dioxide on 20 May 2015. In the Northern Hemisphere (right) carbon dioxide accumulates in the winter and spring when plants are dormant. This model of carbon dioxide levels was produced by NASA's Global Modeling and Assimilation Office using data from the Orbiting Carbon Observatory-2 (OCO-2) satellite.
| px | px | dpi | = | cm | x | cm | = | MB |
Details
Creative#:
TOP20028332
Source:
達志影像
Authorization Type:
RM
Release Information:
須由TPG 完整授權
Model Release:
N/A
Property Release:
N/A
Right to Privacy:
No
Same folder images:
 Loading