
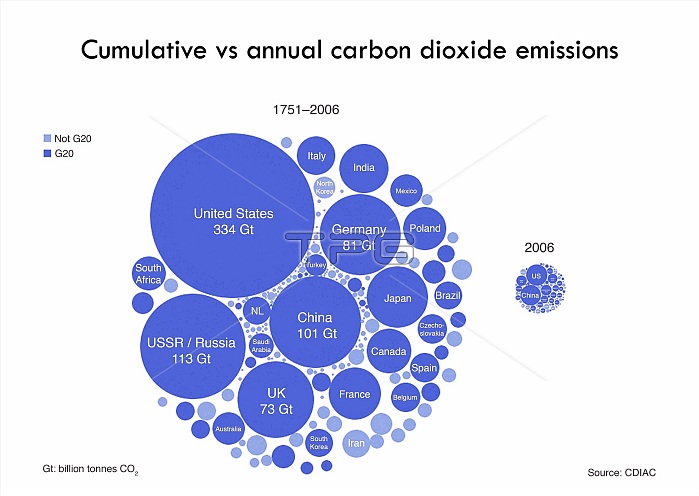
Cumulative and annual carbon dioxide (CO2) emissions. Illustration showing the emissions over time by different countries of CO2 into the Earth's atmosphere. At centre are the CO2 emissions from 1751 to 2006, At right are the CO2 emissions in 2006. The dark blue circles indicate membership of the G20 group of industrially advanced countries. Both diagrams are to scale. The units are in gigatonnes (Gt), with 1 Gt being one billion tonnes of CO2. The USA (334 Gt) dominates, but other major contributors are USSR/Russia (113 Gt), China (101 Gt), Germany (81 Gt), and the UK (73 Gt). The data is from 2010, from CDIAC (Carbon Dioxide Information Analysis Center).
| px | px | dpi | = | cm | x | cm | = | MB |
Details
Creative#:
TOP15789338
Source:
達志影像
Authorization Type:
RM
Release Information:
須由TPG 完整授權
Model Release:
No
Property Release:
No
Right to Privacy:
No
Same folder images:
 Loading