
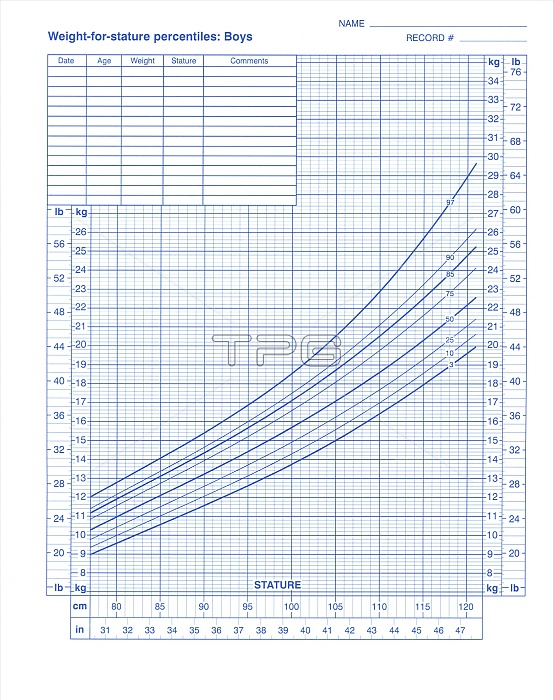
Weight-for-stature chart. This chart is used to determine whether boys are a healthy weight comparative to their height (stature). By finding the point on this graph where a child's height (bottom) and weight (side) intersect, it can be determined whether the child is underweight, healthy, at risk of becoming overweight or overweight. The lines on this graph are percentile curves, if a child's weight and height values intersect between the 85th and 95th percentile then 85-95 per cent of children at that height weigh less and the child is at risk of becoming overweight. However, these charts are not considered to be as accurate as body mass index charts.
| px | px | dpi | = | cm | x | cm | = | MB |
Details
Creative#:
TOP10213511
Source:
達志影像
Authorization Type:
RM
Release Information:
須由TPG 完整授權
Model Release:
N/A
Property Release:
N/A
Right to Privacy:
No
Same folder images:
 Loading