
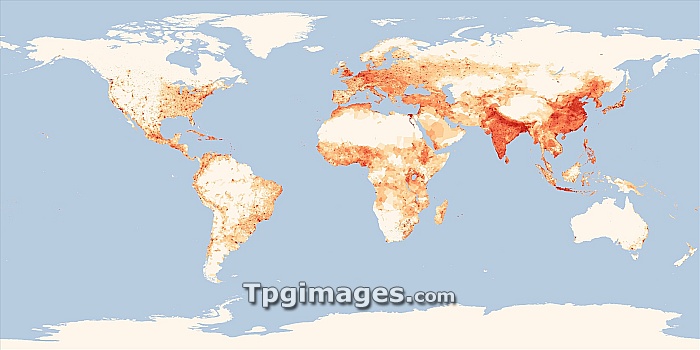
World population density in 2000. Colour-coded map showing the variation in population density around the world in the year 2000. The scale is from 1 (white) to 10,000 or more (red) people per square kilometre. The red dots show the locations of cities, with rural areas being less densely populated. The most densely populated areas are in Japan, China, Indonesia, India and parts of Europe. This map is based on data from the Gridded Population of the World dataset, Version 3 (GPWv3), produced by the Socioeconomic Data and Applications Center (SEDAC), Columbia University, USA.
| px | px | dpi | = | cm | x | cm | = | MB |
Details
Creative#:
TOP06664315
Source:
達志影像
Authorization Type:
RM
Release Information:
須由TPG 完整授權
Model Release:
NO
Property Release:
NO
Right to Privacy:
No
Same folder images:
earthplanetmapgeographyhumangeographysociologymapmodel21stcentury2000citiescitycolourcolourcodedcoloursdemographicdemographicsdensitydesolatedistributiongeographicalglobalinhabitedlandlandcoverlanduseplanetarypopulationpopulationstatisticsruralstatisticalanalysisuninhabitedurbanworldwidegriddedpopulationoftheworldgpwgpwv3version3v.3.0socioeconomicdataandapplicationscentersedac"
"3.03200021stanalysisandapplicationscentercenturycitiescitycodedcolourcolourcolourscoverdatademographicdemographicsdensitydesolatedistributionearthgeographicalgeographygeographyglobalgpwgpwv3griddedhumaninhabitedlandlandlandmapmapmodelofplanetplanetarypopulationpopulationpopulationruralsedacsocioeconomicsociologystatisticalstatisticstheuninhabitedurbanusev.versionworldworldwide
 Loading