
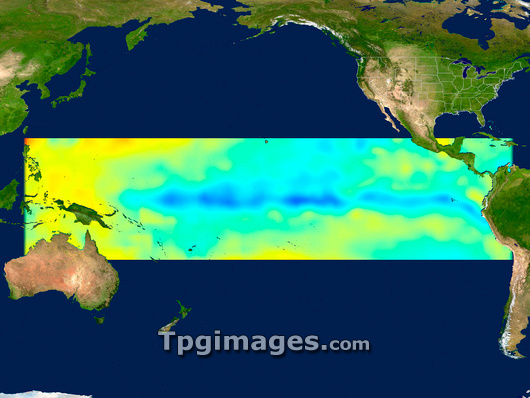
La Nina event, 1999. This sea surface temperature map, compiled from satellite data, is a frame from an animation showing conditions in the Pacific Ocean leading up to a La Nina event in 1999. Lower temperatures are shown in blue, warmer temperatures in yellow and red. A La Nina event is defined as a sustained anomaly in the ocean surface temperature where the average temperature is at least 0.5 degrees Celsius lower than usual (as opposed to an El Nino event, where the temperatures are higher than usual). The cool band can be seen stretching across the equatorial area. La Nina events can have wide-ranging effects on the global climate.
| px | px | dpi | = | cm | x | cm | = | MB |
Details
Creative#:
TOP03207232
Source:
達志影像
Authorization Type:
RM
Release Information:
須由TPG 完整授權
Model Release:
N/A
Property Release:
N/A
Right to Privacy:
No
Same folder images:
 Loading