
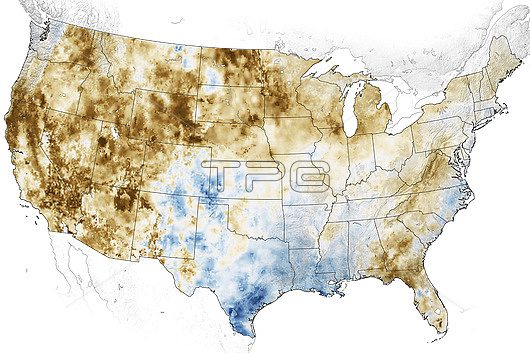
Soil moisture anomaly map of the USA on 5th June 2021. The map shows differences from normal conditions for the time of year in the water content of the first metre of soil. White areas are normal, blue areas, increasing from light to dark, have more water, and brown areas, increasing from light to dark, have less water. Due to increased temperatures and decreased precipitation over 88 percent of the Western USA is experiencing drought conditions. Some 55 percent is experience extreme drought conditions. Data from the Crop Condition and Soil Moisture Analytics (Crop-CASMA) product, which integrates measurements from NASA's Soil Moisture Active Passive (SMAP) satellite and vegetation indices from the Moderate Resolution Imaging Spectroradiometer (MODIS) instruments on NASA's Terra and Aqua satellites.
| px | px | dpi | = | cm | x | cm | = | MB |
Details
Creative#:
TOP26544520
Source:
達志影像
Authorization Type:
RM
Release Information:
須由TPG 完整授權
Model Release:
N/A
Property Release:
N/A
Right to Privacy:
No
Same folder images:
 Loading